
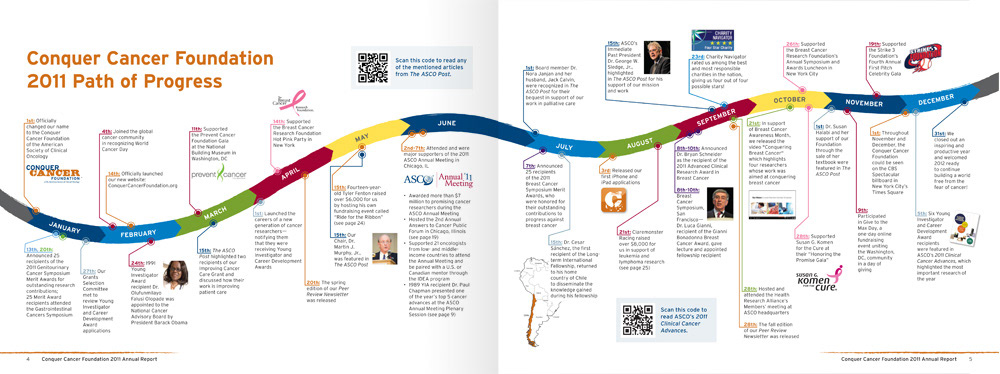

This map spread was made interactive for the online version of the report. Hovering over each pin reveals all of the award and grant winners from that location. To see the interactive PDF, go here.
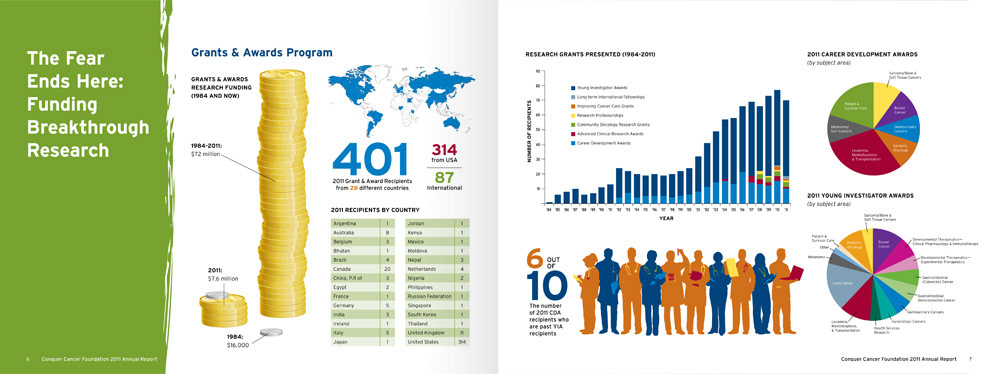
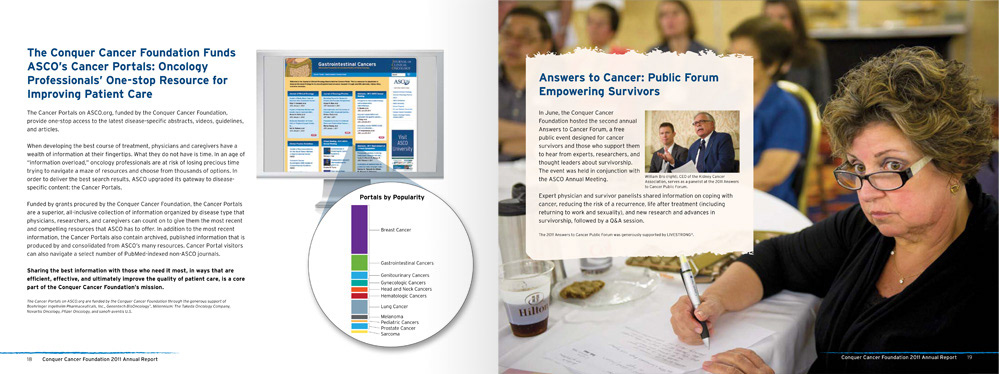

Designed the Conquer Cancer Foundation annual report in 2011. Created infographics for all of the foundation's data and an interactive map to highlight award and grant winners. Two versions were created, 1 for print and 1 as an interactive PDF for web posting.